
Page 19 - Payroll & Premium by Class
P. 19
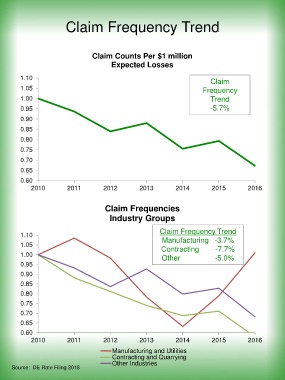
Claim Frequency Trend


                                    Claim Counts Per $1 million
                                           Expected Losses


         1.10                                                                    Claim
         1.05                                                                 Frequency
         1.00                                                                    Trend

         0.95                                                                    -5.7%
         0.90

         0.85
         0.80
         0.75

         0.70
         0.65

         0.60
             2010          2011         2012          2013          2014         2015          2016


                                         Claim Frequencies
                                           Industry Groups


                                                              Claim Frequency Trend
         1.10
                                                              Manufacturing   -3.7%
         1.05                                                 Contracting        -7.7%
         1.00                                                 Other                 -5.0%

         0.95
         0.90
         0.85
         0.80

         0.75
         0.70

         0.65
         0.60
             2010          2011         2012          2013          2014         2015          2016
                                            Manufacturing and Utilities
                                            Contracting and Quarrying
                                            Other Industries
     Source:  DE Rate Filing 2018