

WORKCOMP360 BLOG: How Carriers Can Use Market Insights to Benchmark Loss Ratios
When a carrier’s loss ratio rises, an important question follows: Is the change unique to our book of business, or is the broader market experiencing a similar trend?
A carrier’s historical results are an essential starting point, but they may not tell the full story. Loss ratios can shift because of changes in claim frequency, claim severity, business mix, or broader market conditions. A relevant statewide benchmark helps carriers see where their experience aligns with the market and where it differs.
WorkComp360’s Market Insights dashboard brings that context into the analysis. Carriers can compare measures such as loss ratio, claim frequency, and claim severity with statewide Pennsylvania workers compensation results, then use interactive filters to investigate the differences.
A Practical Example
Start with the Loss Ratio.
Consider a carrier reviewing its workers compensation experience from 2018 through 2023.
The WorkComp360 comparison shows that the carrier’s loss ratio remained above the statewide benchmark throughout the period, although the size of the difference changed from year to year. In 2023, for example, the carrier’s loss ratio was 55.5%, compared with 45.6% statewide.
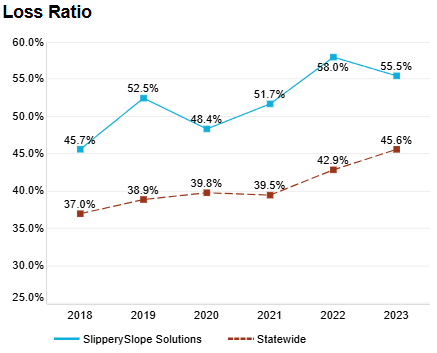
The comparison quickly shows where the carrier’s experience differs from the broader market. It also points to the next question: What is driving the difference?
Examine Claim Frequency
WorkComp360 allows the carrier to look beyond the loss ratio and compare claim frequency.
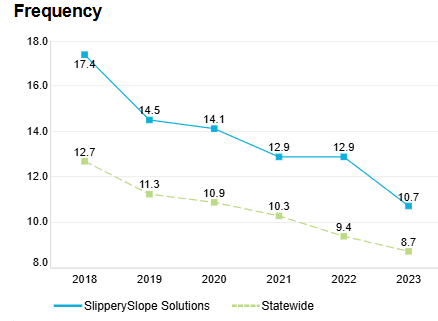
In this example, claim frequency declines over time for both the carrier and the statewide benchmark, but the carrier’s frequency remains consistently higher.
In 2023, the carrier’s frequency was 10.7, compared with 8.7 statewide. That result suggests frequency may be contributing to the carrier’s higher loss ratio.
Frequency is only part of the picture. The carrier can next examine how much its claims are costing.
Compare Indemnity and Medical Severity
WorkComp360 provides separate views of indemnity and medical severity, helping users assess whether differences in claim costs may also be influencing overall performance.


Here, the severity comparisons reveal two different patterns.
The carrier’s indemnity severity was below the statewide benchmark in earlier years, but the difference narrowed over time. By 2023, the carrier’s indemnity severity was approximately $28,000, compared with $26,000 statewide.
Medical severity followed a different pattern. It remained consistently above the statewide benchmark and reached approximately $37,000 in 2023, compared with $29,000 statewide.
Together, the measures provide clearer context for the loss ratio difference. The carrier has higher claim frequency and, particularly in recent years, higher severity in certain areas.
Those findings give the carrier a more focused starting point for further analysis.
Use Filters to Investigate Further
WorkComp360’s interactive filters allow users to move from initial high-level observations to closer examination of all the results.
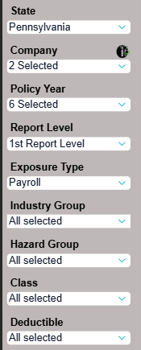
Users can refine the analysis by state, company, policy year, report level, exposure type, industry group, hazard group, class, deductible, and other available dimensions.
After identifying higher medical severity, for example, the carrier could determine whether the difference is concentrated in particular industry groups or classifications. The carrier could explore higher claim frequency across the same segments of its book of business.
Benchmarking then becomes more than a comparison. It becomes a practical starting point for deeper investigation.
Turn Data into Better Questions
The value of benchmarking is not limited to knowing whether a carrier is above or below the statewide average. The real value is having enough context to ask more useful questions:
Is our loss ratio moving differently from the market? Is frequency contributing to the difference? Is severity increasing faster than the statewide benchmark? Are particular industries or classes driving the results?
WorkComp360 brings these measures together in an interactive environment so carriers can understand what happened, see how their experience compares, and identify what to investigate next.
For carriers, that means better context for evaluating their own experience and focusing further analysis. Explore WorkComp360 to compare results, test different views, and uncover the factors that may be shaping performance.