Page 19 - Summary Report
P. 19

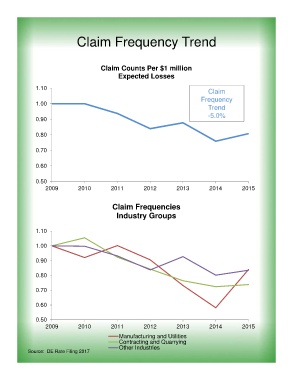
Claim Frequency Trend


                                           Claim Counts Per $1 million
                                                  Expected Losses

                1.10
                                                                                        Claim
                                                                                     Frequency
                1.00
                                                                                        Trend
                                                                                        -5.0%
                0.90


                0.80


                0.70


                0.60


                0.50
                    2009          2010         2011          2012          2013         2014          2015


                                                Claim Frequencies
                                                  Industry Groups


                1.10


                1.00


                0.90


                0.80


                0.70


                0.60

                0.50
                    2009          2010         2011          2012          2013          2014         2015

                                                   Manufacturing and Utilities
                                                   Contracting and Quarrying
                                                   Other Industries
             Source:  DE Rate Filing 2017
   14   15   16   17   18   19   20   21   22   23   24